Simple Summary
The use of machine learning has gained much focus in medical research over the past decade, especially in oncology and medical imaging. However, although many models have been developed by researchers worldwide, there is usually no easy way to use a model in practice or to retrain, fine-tune and improve the model performance. To address this, we developed an easy-to-use toolkit for training and using machine vision models based on Mask R-CNN. We trained a model to detect and classify pancreatic lesions to demonstrate the toolkit's functionality. The model achieved a mean average precision (mAP) of 61.2% and a mean average recall (mAR) of 65.1%; the mAP at thresholds of 50% and 75% were 80.6% and 65.1%, respectively. The platform is open-source and available to download and use at nbcatalyst.com.
Abstract
Interest in applying machine learning (ML) in medical research has exploded over the past decade, especially in oncology and medical imaging. The objective of ML, particularly machine vision in medical imaging, is to solve lesion identification, segmentation, and classification problems. Although numerous studies have developed ML models that can be beneficial in various clinical settings, there is often no easy way to apply the models in practice without technical knowledge. To address this issue, in the process of developing an ML model to detect and categorize pancreatic lesions as either cystic or solid, we developed the PCP2 Toolkit. PCP2 is an open-source tool for training and using Mask R-CNN-based ML vision models. PCP2’s core ML functionality is implemented in Python and the user interface in JavaScript. Here, we discuss the architecture, workflow, and application of PCP2 and demonstrate its use in training a model to classify pancreatic lesions on Computed Tomography (CT) images. The model achieved a mean average precision (mAP) of 61.2% and a mean average recall (mAR) of 65.1%. The mAP at Intersection over Union (IoU) thresholds of 50% and 75% were 80.6% and 65.1%, respectively. The source code, documentation, and trained model are available at nbcatalyst.com. Our objective is to provide an easy-to-use, customizable, and extendable tool for training machine vision models and using the trained model in the real world.
Machine Learning
Imaging
Pancreatic Mass
Mask R-CNN
Computed Tomography
Introduction
The resurgence of machine learning (ML), advancements in convolutional neural networks (CNN), cloud computing, and computing capacity, coupled with affordability, have significantly broadened the reach and accessibility of ML technology. Medical imaging such as computed tomography (CT) and magnetic resonance imaging (MRI) have contributed to an order of magnitude leap in the quality of clinical patient care, especially in oncology [1]. However, although clinicians have accumulated much experience interpreting medical images, it is at times difficult to distinguish or identify some lesions on CT and MRI, for example, pancreatic cystic lesions from solid pancreatic masses [2]; or accurately identifying undifferentiated pancreatic carcinomas [3], which are very rare and seldom seen in clinical practice. Machine vision, a sub-field of ML that allows computers to learn from and make inferences on image-based data, offers a way to meet these challenges. ML algorithms have been used to detect lesions on CT, MRI and ultrasound (US) with excellent results [4–6].
However, although the number of machine vision models developed and published in literature has increased and continues to grow tremendously, the medical community generally has no easy way to use the models in day-to-day practice or contribute to improving model performance. In most situations, models are developed with in-house tools that are not open-source or publicly accessible. Although training an ML model requires understanding computer science and programming, using a trained model should not have the same requirement. Furthermore, testing and reproducing a model should also be more accessible.
Therefore, in developing a model to detect, segment and classify pancreatic lesions, we decided first to address this issue. We developed an open-source, graphical user interface-based tool that enables training, retraining and using trained ML object detection models using simple 2D images with minimal to no learning curve. We present the PCP2 toolkit and discuss its architecture and workflow, and a model trained to classify pancreatic lesions using it and how to use it to make inferences on medical images. The PCP2 toolkit code base, documentation and tutorial video (see supplementary video S1) are publicly available at nbcatalyst.com.
Toolkit
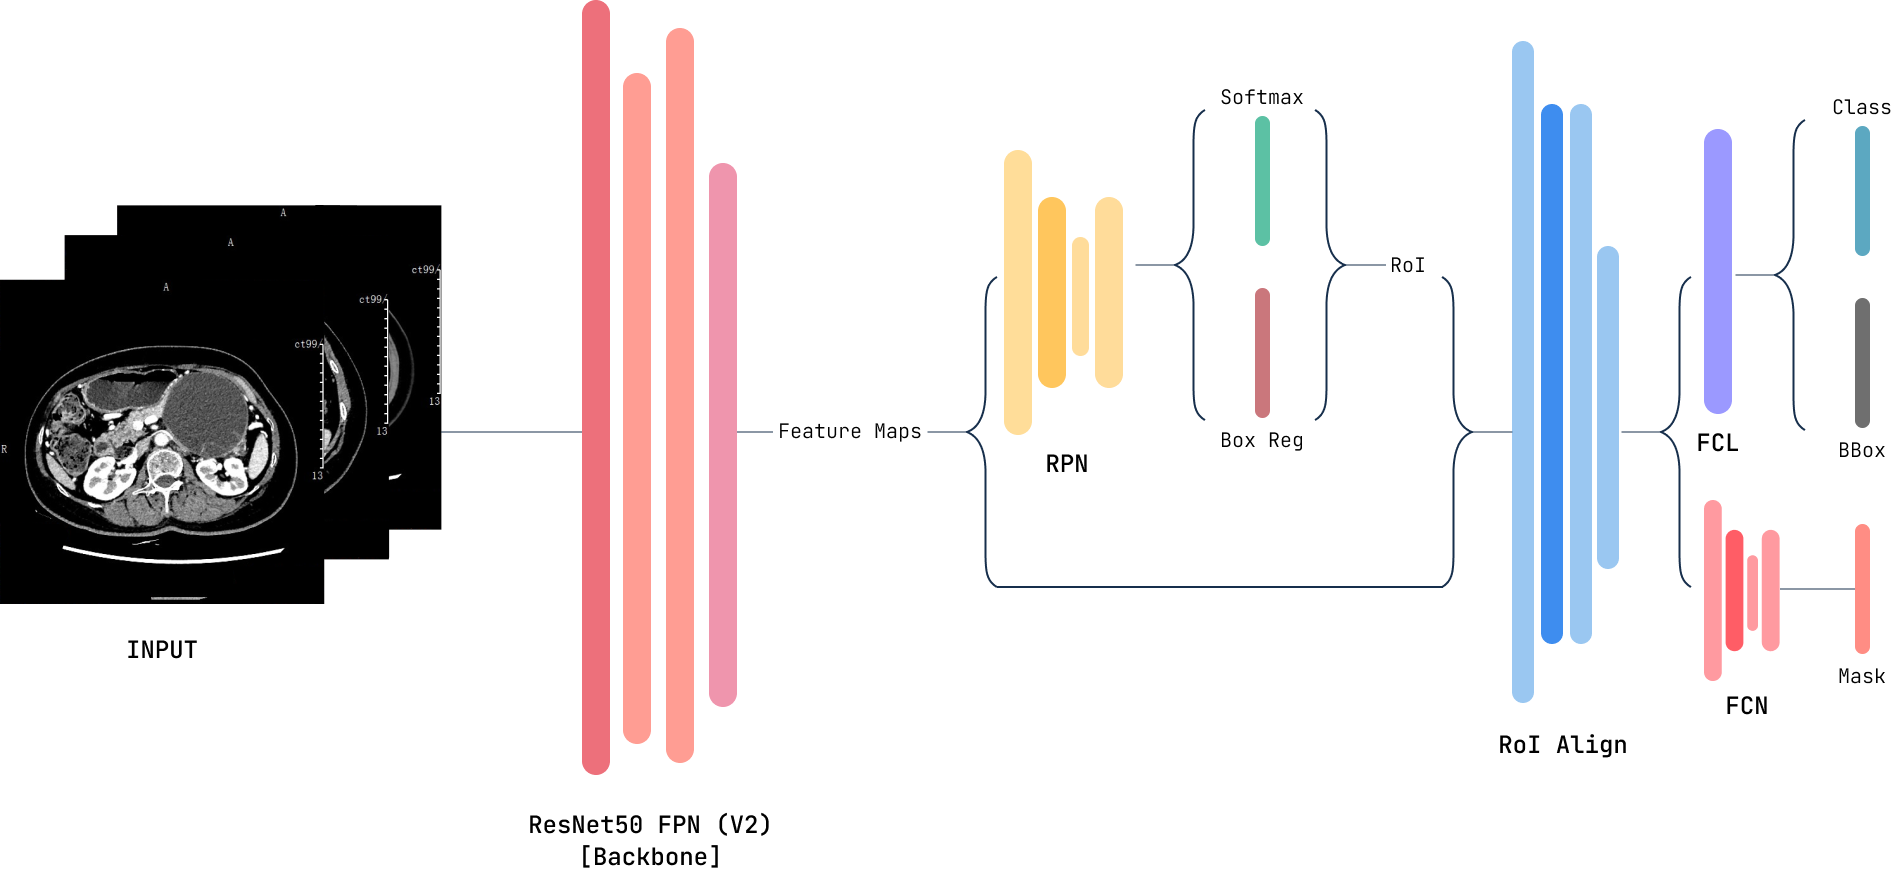
The PCP2 toolkit comprises two modules; the core ML API module built with python and a front user interface (UI) built with JavaScript deployable as a web app. The current version of the PCP2 toolkit can be used to train object detection models for any medical (or non-medical) image dataset and use any of the trained models to make predictions/inferences. The toolkit has the following features: (i) loading images and image annotation data; (ii) processing the images to extract masks and bounding boxes; (iii) training (or retaining) a model and saving a new model; (iv) loading a saved model and making inferences. The ML models trained with the toolkit are based on the Mask R-CNN [7] architecture implemented in PyTorch.
Mask R-CNN
Mask R-CNN is an image segmentation model built on top of the Faster Region Convolutional Neural Network (Faster R-CNN) [8]. Faster R-CNN is an improvement on Fast R-CNN [9] and R-CNN [10]. The R-CNN algorithm uses the selective search algorithm to extract region proposals, then uses a pre-trained CNN to extract regions of interest (RoI). Finally, each ROI is classified using the extracted futures. Fast R-CNN introduced RoI Pooling to solve the sluggishness of R-CNN, but the region proposal was still handled by selective search. Faster R-CNN added a Region Proposal Network (RPN), eliminating the need for the selective search. Faster R-CNN, like its predecessors, returns bounding boxes for every RoI, a class label and a confidence score.
Mask R-CNN replaces the RoI Pooling with an RoIAlign layer which preserves the spatial information of the RoI. The information extracted by RoIAlign is passed on to the mask component, which generates a mask for each RoI. Through this process, Mask R-CNN segments the input image pixel-to-pixel. The network is capable of both semantic and instance segmentations. Semantic segmentation assigns each pixel in the image to a category with differentiating individual objects. In essence, semantic segmentation extracts the subjects/foreground from the background of the image. On the other hand, instance segmentation detects individual objects in the image. Mask R-CNN returns a bounding box, mask, class label and confidence score per RoI. The Mask R-CNN model architecture is shown in Figure 1.
Transfer Learning
One of the major constraints on training ML models is a lack of adequate training data. However, it is unnecessary to train a model from scratch in most situations and for researchers without access to large datasets and extensive computing resources. We can fine-tune a pre-trained model or initialize a model with pre-trained weights, then train the model with a custom dataset with custom classes. The PCP2 toolkit uses transfer learning to facilitate training a model on a smaller dataset. A model can be initialized with weights trained on the Microsoft COCO dataset, which contains more than 300 thousand images and 1.5 million object instances [11]. Once a model has been trained, it can be fine-tuned with new training data.
Annotation and Processing
To train a model on your dataset, medical images such as MRI or CT and a file containing the image annotation information are loaded into the toolkit. Annotation can be performed using tools such as Labelbox, labelImg or Prod.igy. A mask is required for each object; the bounding box is optional. The toolkit will extract the mask from the image and the bounding box. Currently, only regular 2D images are supported. In inference mode, no image preprocessing is required. Select single or multiple images in the UI to make inferences. The PCP2 toolkit will automatically handle processing, load the trained model and return the predicted outcome.
Model Evaluation
For most classification models, accuracy, area under the curve (AUC) or the concordance index (C-index) are the go-to methods for assessing and reporting model performance. However, we take a different approach when evaluating object detection models. The Mean Average Precision (mAP) is used. The mAP is calculated based on the model’s precision and recall, Intersection over Union (IoU) and a confusion matrix.
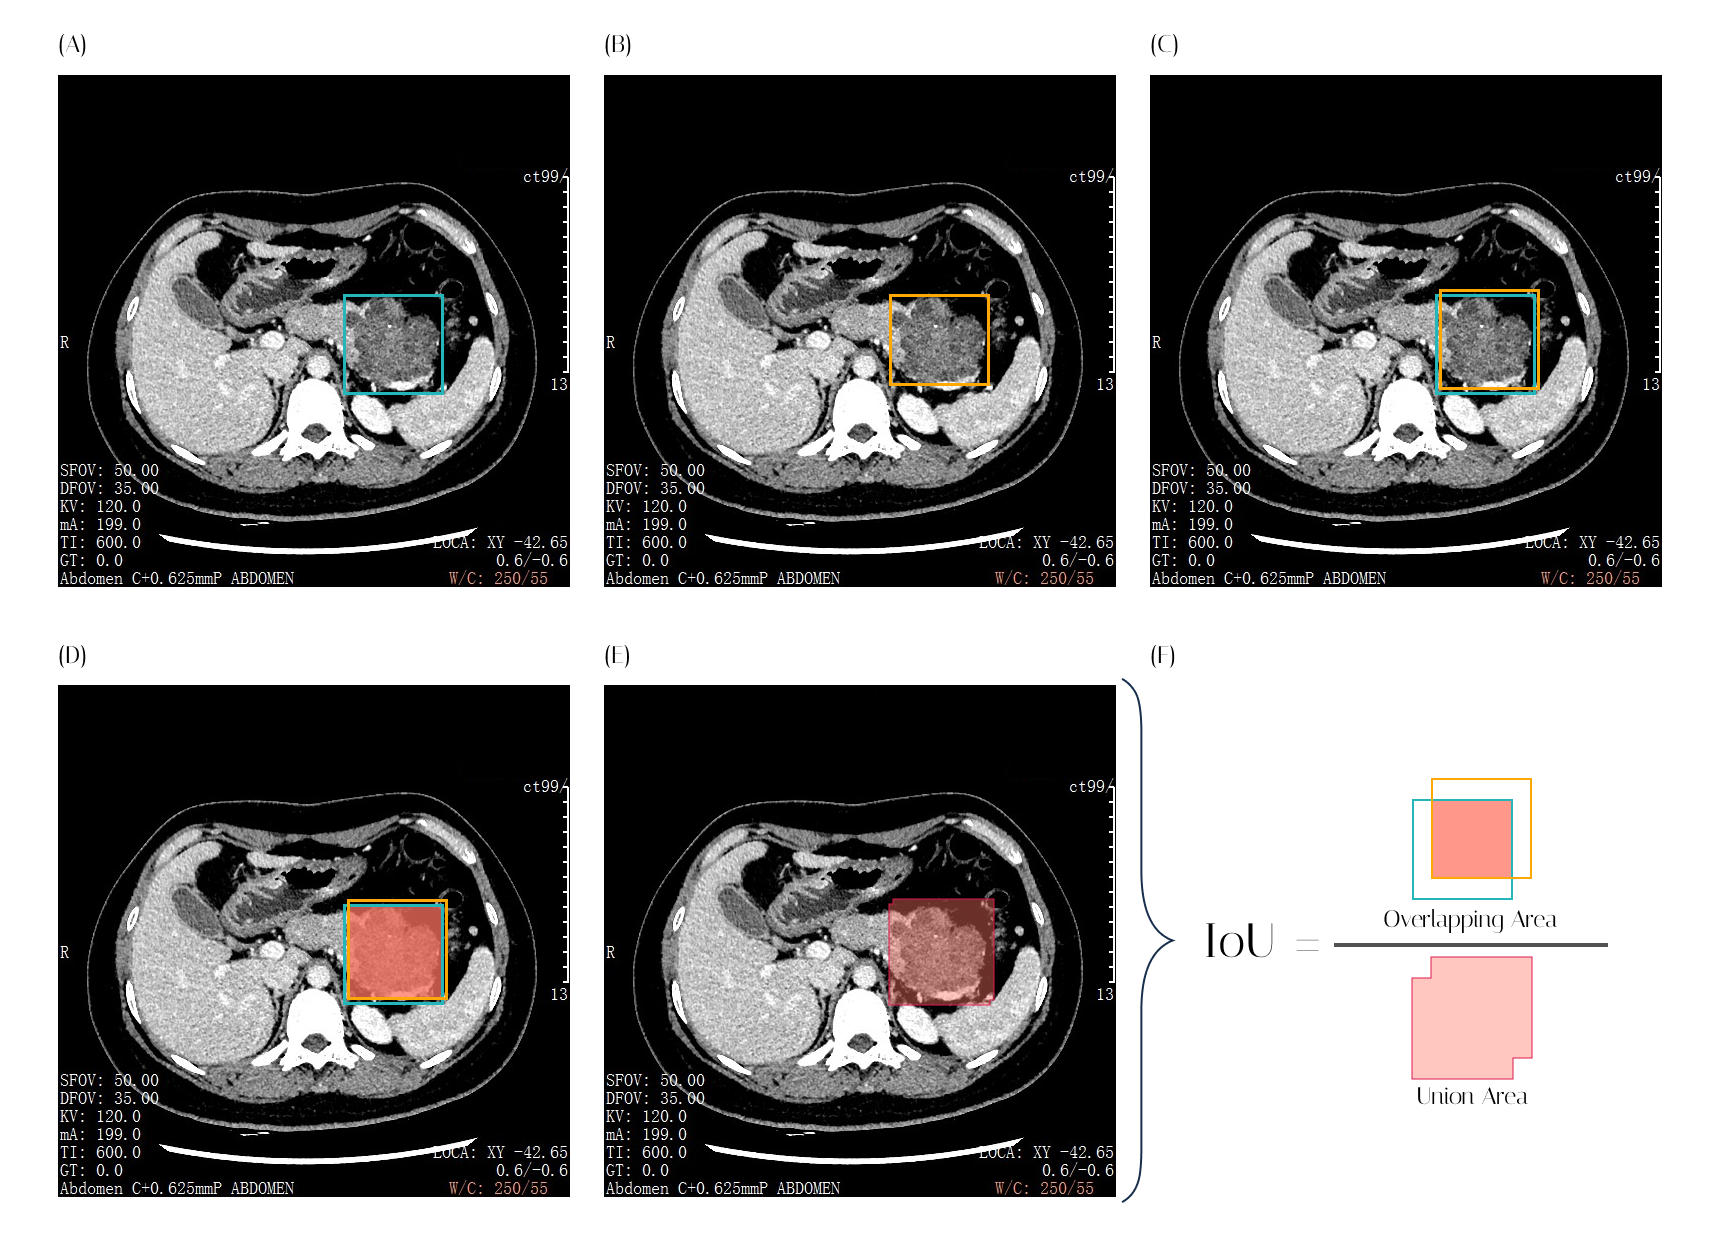
The IoU in an object detection model is a measure of overlap between the model-predicted bounding box and the ground truth box. IoU is the ratio of the overlapping area of the two boxes to the area of the union of the two boxes, as shown in Figure 2. The IoU value ranges from 0 to 1. The closer the IoU is to 1, the close the predicted bounding box is to the actual object’s bounding box.
Confusion matrix, Precision and Recall
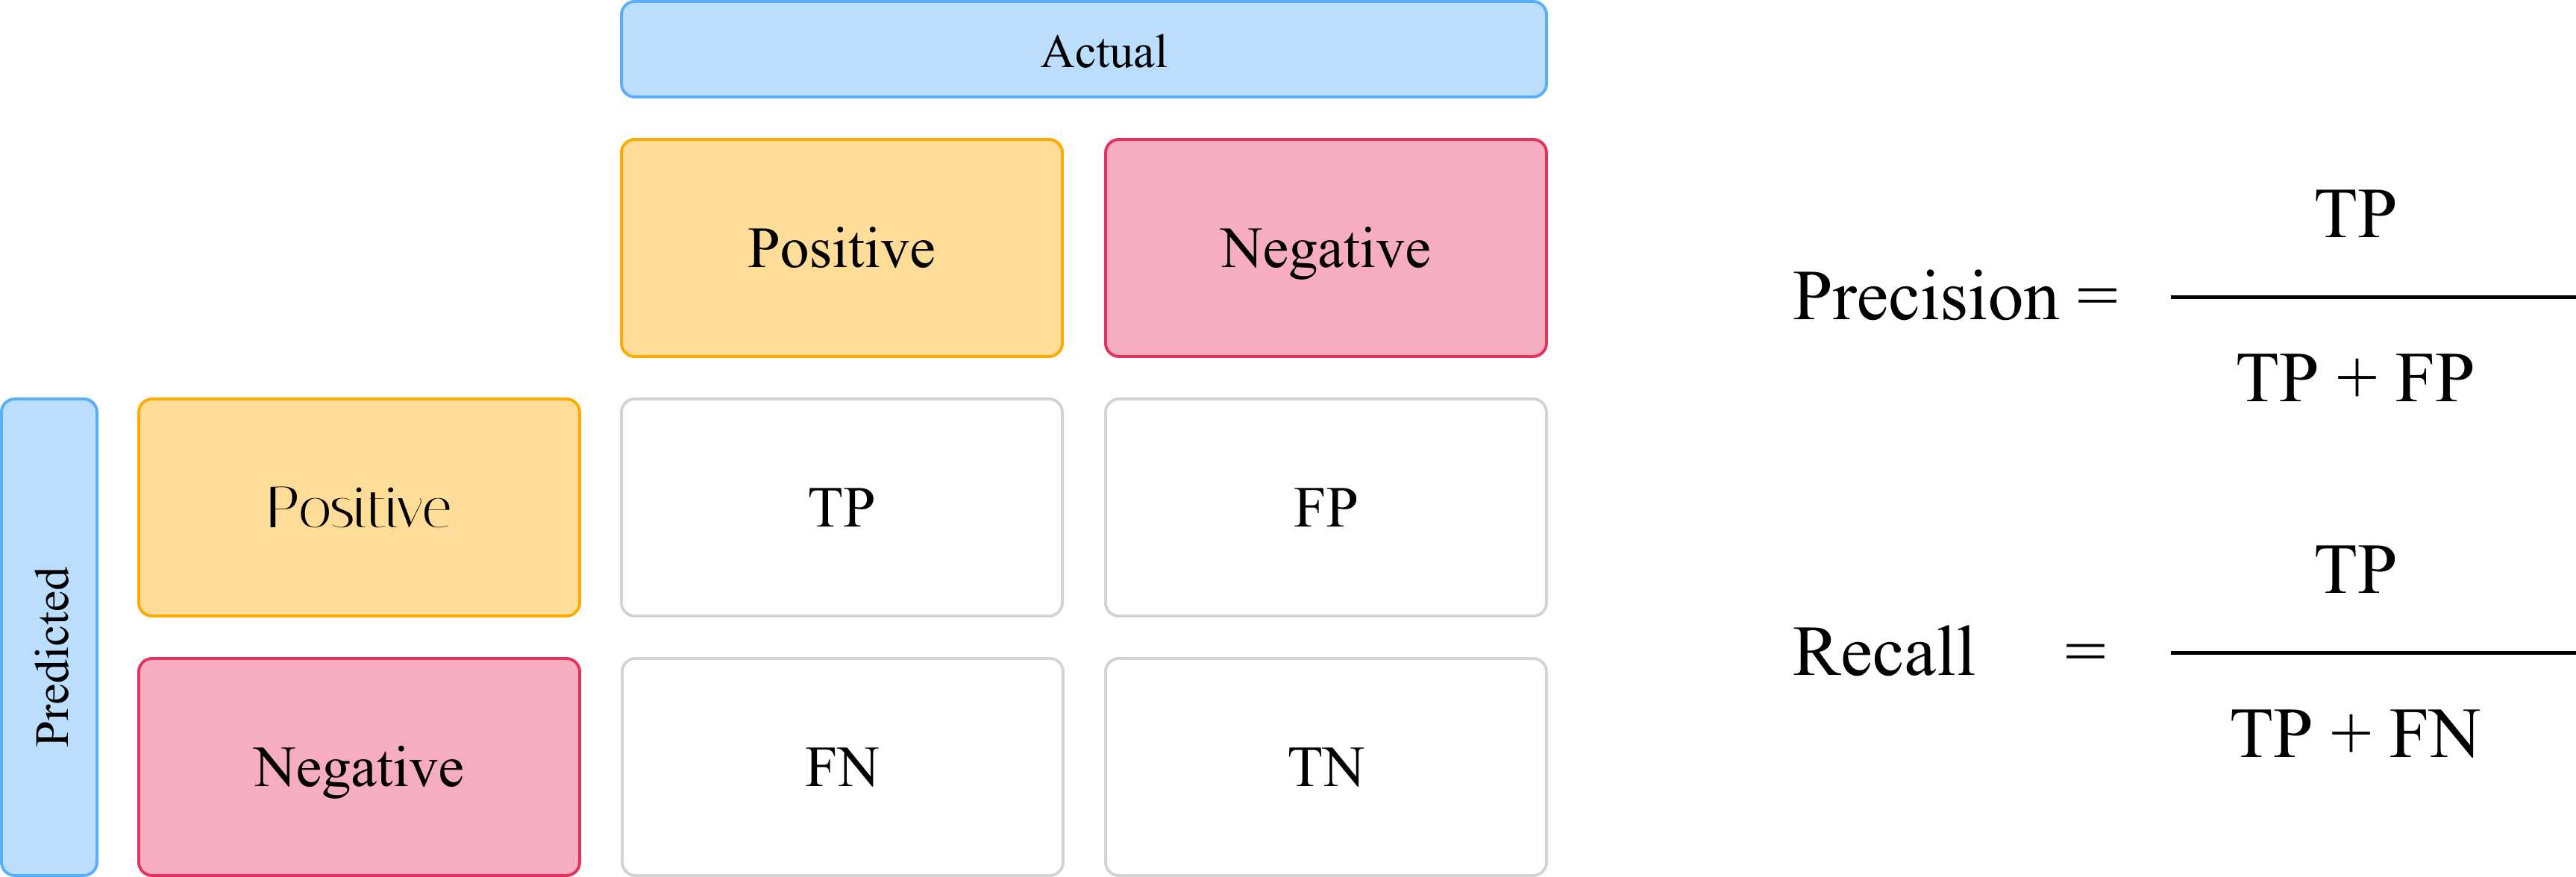
The confusion matrix, as shown in Figure 3, is one of the most common tools used to measure the performance of a classification model. It can be applied to binary or multi-class classification problems. We can then use the confusion matrix to determine the True Positive (TP), False Positive (FP), True Negative (TN) and False Negative (FN) rates of a model. These values derived from the confusion matrix are then used to determine the precision and recall of the model. Precision measures the model’s ability to detect true positives out of the pool of all positives (TP + FP). In determining the object detection model’s precision, with the IoU as the threshold. As such, the precision will vary depending on the selected IoU threshold. The recall of a classifier model is a measure of how well the model can correctly predict true positives from all the positive classes.
Mean Average Precision (mAP)
The mAP of the model is calculated based on the precision and recalls values of the model within a range of IoU thresholds. The average precision AP is determined by averaging precision across all recall values of the model [12]. To calculate the mAP of the model, the AP for each class in the model is calculated and then averaged over the number of classes. By default, the PCP2 toolkit reports the mAP, mAP at IoU threshold of 0.5 (mAP 50) and mAP at the IoU threshold of 0.75 (mAP 75). For the mAR, mAR at 100 maximum detections per image (mAR 100 or simply mAR), mAR at 1 maximum detection (mAR 1) and mAR at 10 maximum detection per image are reported
Case Study - Pancreatic Lesion Classifier Model
Overview
Pancreatic cancers are very aggressive and have a high mortality rate [13]. Although several medical imaging modalities detect pancreatic lesions, it is often challenging to pre-operatively accurately identify pancreatic cystic lesions on imaging due to morphological diversity and overlap. Pancreatic cystic lesions often have several solid components with different characteristics [14]. Several ML approaches can be explored to solve this problem, such as radiomics-based classifiers [15,16] and the object detection approach [17–19]. Mask R-CNN is an object detection and segmentation approach with good performance and has been used to develop tumor detection models in other studies [19–21]. Therefore, we sought to train an ML model based on Mask R-CNN to detect and categorize pancreatic lesions on CT images. We used the process of training this model to demonstrate the use of the toolkit in models and using the trained models to make predictions.
Materials and Methods
CT images of patients diagnosed with pancreatic lesions classified as either cystic or solid pancreatic lesions postoperatively were retrospectively retrieved from the database of Ningbo Medical Center Li Huili Hospital. The images were exported as PNG and annotated using Prod.igy (version 1.11.0, Explosion GmbH, Germany) by experienced radiologists. The annotated data was loaded into the PCP2 toolkit. The images were randomly split into training and validation sets with a ratio of 80:20. A model was trained using the toolkit via transfer learning.
Results
CT images of 102 who underwent surgical resection at Ningbo Medical Center Li Huili Hospital between January 2017 and June 2022 for pancreatic lesions were included in the dataset. 34 patients were classified as cystic pancreatic lesions and 68 as solid lesions. Images of 100% of the patients with cystic lesions were included, while 60% (36) of those with solid lesions were included in the final data set. The final image dataset included more than 1300 annotated CT images. A new model object was created using the PCP2 toolkit with two object classes (Cystic and Solid). The annotated data was loaded into the toolkit. 80% of the data was used for training the model and 20% for cross-validation. The model was trained for 10 epochs, Table 1. The model was then evaluated to determine its performance over 10 epochs, with results shown in Table 2. The mAP of the model was 61.2%. the mAP50 and mAP75 were 80.6% and 65.1%, respectively. mAR1, mAR10 and mAR100 were 65.1%, 60.0% and 65.0%, respectively. The trained model could then be used to make inferences on new images. The total training time for the model was 9 hours and 56 minutes. However, the model was trained without the use of Graphical processing unit (GPU) acceleration. The training time can be significantly shorter if a GPU is used.
Table 1: Model Training for 10 Epochs
| Epoch |
Avg. Loss |
mAP |
mAP 50 |
mAP 75 |
mAR |
mAR 1 |
mAR 10 |
| #1 |
0.335 |
0.186 |
0.432 |
0.091 |
0.383 |
0.287 |
0.362 |
| #2 |
0.206 |
0.362 |
0.615 |
0.361 |
0.526 |
0.424 |
0.505 |
| #3 |
0.134 |
0.420 |
0.651 |
0.499 |
0.544 |
0.412 |
0.544 |
| #4 |
0.090 |
0.452 |
0.689 |
0.482 |
0.534 |
0.454 |
0.534 |
| #5 |
0.075 |
0.442 |
0.694 |
0.452 |
0.545 |
0.445 |
0.545 |
| #6 |
0.063 |
0.501 |
0.778 |
0.500 |
0.545 |
0.510 |
0.545 |
| #7 |
0.054 |
0.548 |
0.817 |
0.583 |
0.616 |
0.546 |
0.615 |
| #8 |
0.044 |
0.488 |
0.674 |
0.579 |
0.549 |
0.502 |
0.549 |
| #9 |
0.040 |
0.512 |
0.777 |
0.592 |
0.558 |
0.492 |
0.558 |
| #10 |
0.037 |
0.515 |
0.832 |
0.494 |
0.583 |
0.537 |
0.583 |
mAP is calculated for IoU thresholds 0.5 through 0.95. mAR is the mAR at maximum of 100 detections. mAP 50 is the mAP value when the IoU threshold is set at 0.5; mAP 75 is the mAP value for IoU threshold of 0.75. mAR 1 and mAR 10 are the mAR values for 1 and 10 maximum detections, respectively. mAP: Mean Average Precision; mAR: Mean Average Recall; Avg. Loss: Average loss
After evaluating the model, we used the toolkit to make inferences on CT images not included in the training and validation datasets. We set the “Score Threshold” when making inferences to 70%. Predictions with a confidence score of less than 0.7 would be rejected and not returned as predictions.
Table 2: Model Evaluation for 10 Epochs
| Epoch |
mAP |
mAP 50 |
mAP 75 |
mAR |
mAR 1 |
mAR 10 |
| #1 |
0.585 |
0.742 |
0.643 |
0.616 |
0.579 |
0.616 |
| #2 |
0.638 |
0.840 |
0.690 |
0.686 |
0.608 |
0.686 |
| #3 |
0.688 |
0.862 |
0.753 |
0.720 |
0.681 |
0.719 |
| #4 |
0.593 |
0.833 |
0.618 |
0.661 |
0.575 |
0.661 |
| #5 |
0.623 |
0.834 |
0.638 |
0.652 |
0.614 |
0.652 |
| #6 |
0.563 |
0.766 |
0.578 |
0.605 |
0.568 |
0.605 |
| #7 |
0.583 |
0.786 |
0.638 |
0.620 |
0.572 |
0.620 |
| #8 |
0.592 |
0.767 |
0.617 |
0.629 |
0.576 |
0.629 |
| #9 |
0.636 |
0.832 |
0.671 |
0.677 |
0.621 |
0.677 |
| #10 |
0.617 |
0.802 |
0.662 |
0.646 |
0.604 |
0.646 |
mAP is calculated for IoU thresholds 0.5 through 0.95. mAR is the mAR at maximum of 100 detections. mAP 50 is the mAP value when the IoU threshold is set at 0.5; mAP 75 is the mAP value for IoU threshold of 0.75. mAR 1 and mAR 10 are the mAR values for 1 and 10 maximum detections, respectively. mAP: Mean Average Precision; mAR: Mean Average Recall
Conclusions
The PCP2 toolkit is an open-source, extendable, customizable, easy-to-use graphical user interface-based platform for training and using object detection ML models. Models in train in the toolkit are based on Mask R-CNN. We include a model to detect and categorize pancreatic lesions on CT images with an acceptable performance with a good mAP and mAR. In the future, we hope the toolkit can integrate more features and support a wider variety of ML models.
Supplementary Materials: Video S1: PCP2 Toolkit Tutorial (https://doi.org/10.5281/zenodo.7488038)
Author Contributions: Conceptualization, J.M. and J.H.; writing—original draft preparation, J.M.; writing—review and editing, J.H. and J.M.; supervision, J.H and C.L.; methodology, J.M and G.H.L.; software, J.M.; validation, Z.H.L., G.H.L and J.H.; data curation, G.H.L, Z.H.L. and J.M; resources, C.L.; All authors have read and agreed to the published version of the manuscript.
Funding: This research received no external funding.
Institutional Review Board Statement: Not applicable.
Informed Consent Statement: Not applicable.
Data Availability Statement: The source code is open-source and publicly available. The data may be made available upon request to the corresponding author.
Conflicts of Interest: The authors declare no conflict of interest.
References
- Xian, J.; Zhang, Z.; Wang, Z.; Li, J.; Yang, B.; Man, F.; Chang, Q.; Zhang, Y. Value of MR imaging in the differentiation of benign and malignant orbital tumors in adults. Eur Radiol 2010, 20, 1692–702. https://doi.org/10.1007/s00330-009-1711-0.
- Farrell, J.J. Prevalence, Diagnosis and Management of Pancreatic Cystic Neoplasms: Current Status and Future Directions. Gut Liver 2015, 9, 571–89. https://doi.org/10.5009/gnl15063.
- Mugaanyi, J.; Lu, C.; Lu, C.; Wang, C. Extended pancreato-duodenectomy coupled with adjuvant chemotherapy for SMARCB1/INI1 deficient pancreatic carcinoma: A case report and literature review. Int J Surg Case Rep 2021, 82, 105938. https://doi.org/10.1016/j.ijscr.2021.105938.
- Hwang, E.J.; Park, S.; Jin, K.N.; Kim, J.I.; Choi, S.Y.; Lee, J.H.; Goo, J.M.; Aum, J.; Yim, J.J.; Cohen, J.G.; et al. Development and Validation of a Deep Learning-Based Automated Detection Algorithm for Major Thoracic Diseases on Chest Radiographs. JAMA Netw Open 2019, 2, e191095. https://doi.org/10.1001/jamanetworkopen.2019.1095.
- Expert Panel on Gastrointestinal, I.; Scheirey, C.D.; Fowler, K.J.; Therrien, J.A.; Kim, D.H.; Al-Refaie, W.B.; Camacho, M.A.; Cash, B.D.; Chang, K.J.; Garcia, E.M.; et al. ACR Appropriateness Criteria((R)) Acute Nonlocalized Abdominal Pain. J Am Coll Radiol 2018, 15, S217–S231. https://doi.org/10.1016/j.jacr.2018.09.010.
- Wang, X.; Wang, S.; Yin, X.; Zheng, Y. MRI-based radiomics distinguish different pathological types of hepatocellular carcinoma. Comput Biol Med 2022, 141, 105058. https://doi.org/10.1016/j.compbiomed.2021.105058.
- He, K.; Gkioxari, G.; Dollár, P.; Girshick, R. Mask r-cnn. In Proceedings of the Proceedings of the IEEE international conference on computer vision, pp. 2961–2969.
- Ren, S.; He, K.; Girshick, R.; Sun, J. Faster r-cnn: Towards real-time object detection with region proposal networks. Advances in neural information processing systems 2015, 28.
- Girshick, R.B. Fast R-CNN. 2015 IEEE International Conference on Computer Vision (ICCV) 2015, pp. 1440–1448.
- Girshick, R.B.; Donahue, J.; Darrell, T.; Malik, J. Rich Feature Hierarchies for Accurate Object Detection and Semantic Segmentation. 2014 IEEE Conference on Computer Vision and Pattern Recognition 2013, pp. 580–587.
- Lin, T.Y.; Maire, M.; Belongie, S.J.; Hays, J.; Perona, P.; Ramanan, D.; Dollár, P.; Zitnick, C.L. Microsoft COCO: Common Objects in Context. In Proceedings of the European Conference on Computer Vision.
- Everingham, M.; Van Gool, L.; Williams, C.K.I.; Winn, J.; Zisserman, A. The Pascal Visual Object Classes (VOC) Challenge. International Journal of Computer Vision 2010, 88, 303–338. https://doi.org/10.1007/s11263-009-0275-4.
- Siegel, R.L.; Miller, K.D.; Fuchs, H.E.; Jemal, A. Cancer statistics, 2021. Ca Cancer J Clin 2021, 71, 7–33.
- Abdelkader, A.; Hunt, B.; Hartley, C.P.; Panarelli, N.C.; Giorgadze, T. Cystic Lesions of the Pancreas: Differential Diagnosis and
Cytologic-Histologic Correlation. Arch Pathol Lab Med 2020, 144, 47–61. https://doi.org/10.5858/arpa.2019-0308-RA.
- Granata, V.; Grassi, R.; Fusco, R.; Galdiero, R.; Setola, S.; Palaia, R.; Belli, A.; Silvestro, L.; Cozzi, D.; Brunese, L. Pancreatic cancer detection and characterization: state of the art and radiomics. Eur Rev Med Pharmacol Sci 2021, 25, 3684–3699.
- Nasief, H.; Zheng, C.; Schott, D.; Hall, W.; Tsai, S.; Erickson, B.; Allen Li, X. A machine learning based delta-radiomics process for early prediction of treatment response of pancreatic cancer. NPJ precision oncology 2019, 3, 1–10.
- Tian, G.; Xu, D.; He, Y.; Chai, W.; Deng, Z.; Cheng, C.; Jin, X.; Wei, G.; Zhao, Q.; Jiang, T. Deep learning for real-time auxiliary
diagnosis of pancreatic cancer in endoscopic ultrasonography. Frontiers in Oncology 2022, 12, 973652.
- George, J.; Skaria, S.; Varun, V. Using YOLO based deep learning network for real time detection and localization of lung nodules from low dose CT scans. In Proceedings of the Medical Imaging 2018: Computer-Aided Diagnosis. SPIE, Vol. 10575, pp. 347–355.
- Raza, S.K.; Sarwar, S.S.; Syed, S.M.; Khan, N.A. Classification and Segmentation of Breast Tumor Using Mask R-CNN on Mammograms 2021.
- Jeong, J.; Lei, Y.; Kahn, S.; Liu, T.; Curran, W.J.; Shu, H.K.; Mao, H.; Yang, X. Brain tumor segmentation using 3D Mask R-CNN for
dynamic susceptibility contrast enhanced perfusion imaging. Physics in Medicine Biology 2020, 65, 185009.
- Shu, J.H.; Nian, F.D.; Yu, M.H.; Li, X. An improved mask R-CNN model for multiorgan segmentation. Mathematical Problems in Engineering 2020, 2020.